

XJAnalyser Module
Add visual analysis and debug capabilities to your XJTAG tools
XJAnalyser Module provides an intuitive interface for setting output pin states and values, and reading input values from a circuit in near real time. The default view uses colour coding on a visual representation of devices in the circuit, but tables can also be used as can a logic analyser style view.
The module is available:
- as an add-on to XJDeveloper, where it gives access to the Analyser screen and to the XJInvestigator application
- as an upgrade to XJRunner, this converts the licence to XJInvestigator, giving the ability to run the XJAnalyser, XJRunner and XJInvestigator applications.
- as a standalone licence, where it gives the ability to run the XJAnalyser application which in addition to providing graphical JTAG chain control/view functionality also has the facility to run SVF and STAPL / JAM files.
XJInvestigator is a repair focused, integrated test and debug environment for fault analysis, combining the test capabilities of XJRunner and XJAnalyser with additional diagnostic functionality.
Benefits
Gives access to components that can’t be probed
Read and write access pins on BGA and fine-pitch devices or where test points aren’t available.
Ready to use within minutes
Connecting the standalone XJAnalyser app to the JTAG chain is very simple.
Quickly debug and verify manufacturing faults
Allows you to increase yields by quickly confirming test results or checking a fix.
Control and monitor the pins on JTAG devices
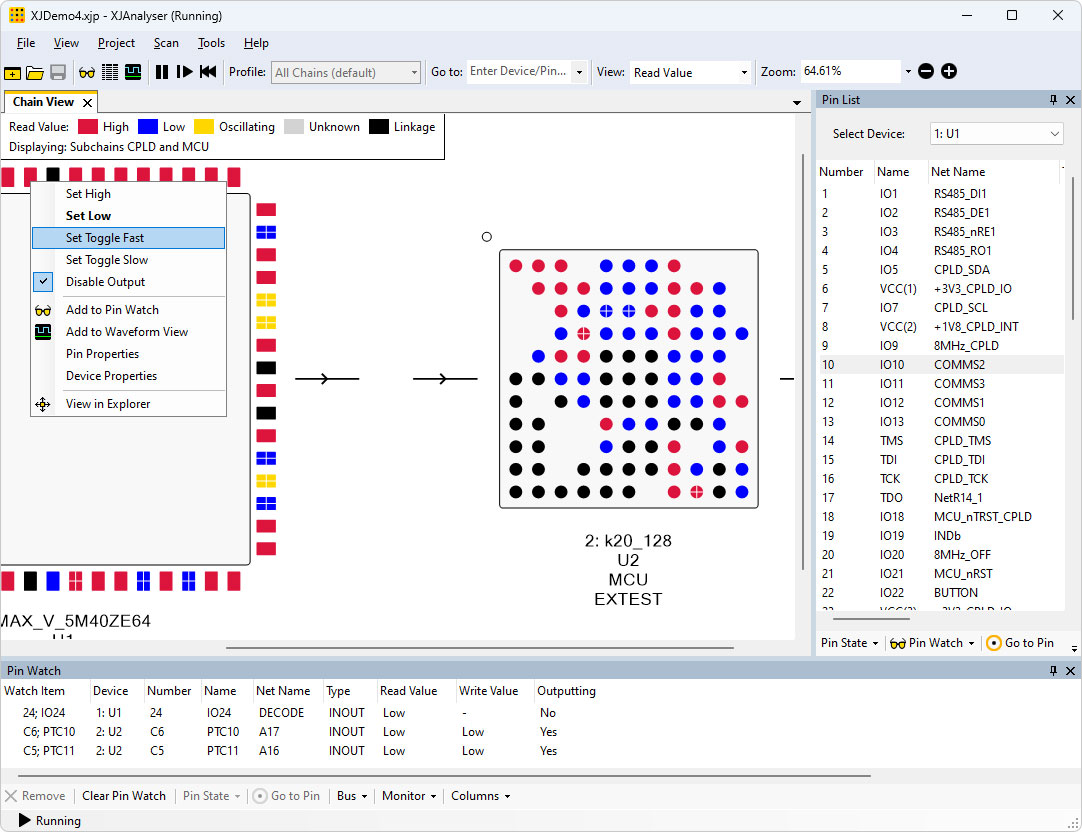
Pin values can be set high or low, or into slow or fast toggle, all at a click of the mouse. The pin colours then indicate their values in real time.
You can place pins in a ‘watch window’ to make it easy to see their changes amongst all of the pins around them on a device, or configure the watch window to automatically add any pins which change value in the circuit.
Buses can be built from pins in the watch window; you can then write a value to the bus to set all of those pins at once.
Visualise the pin states intuitively
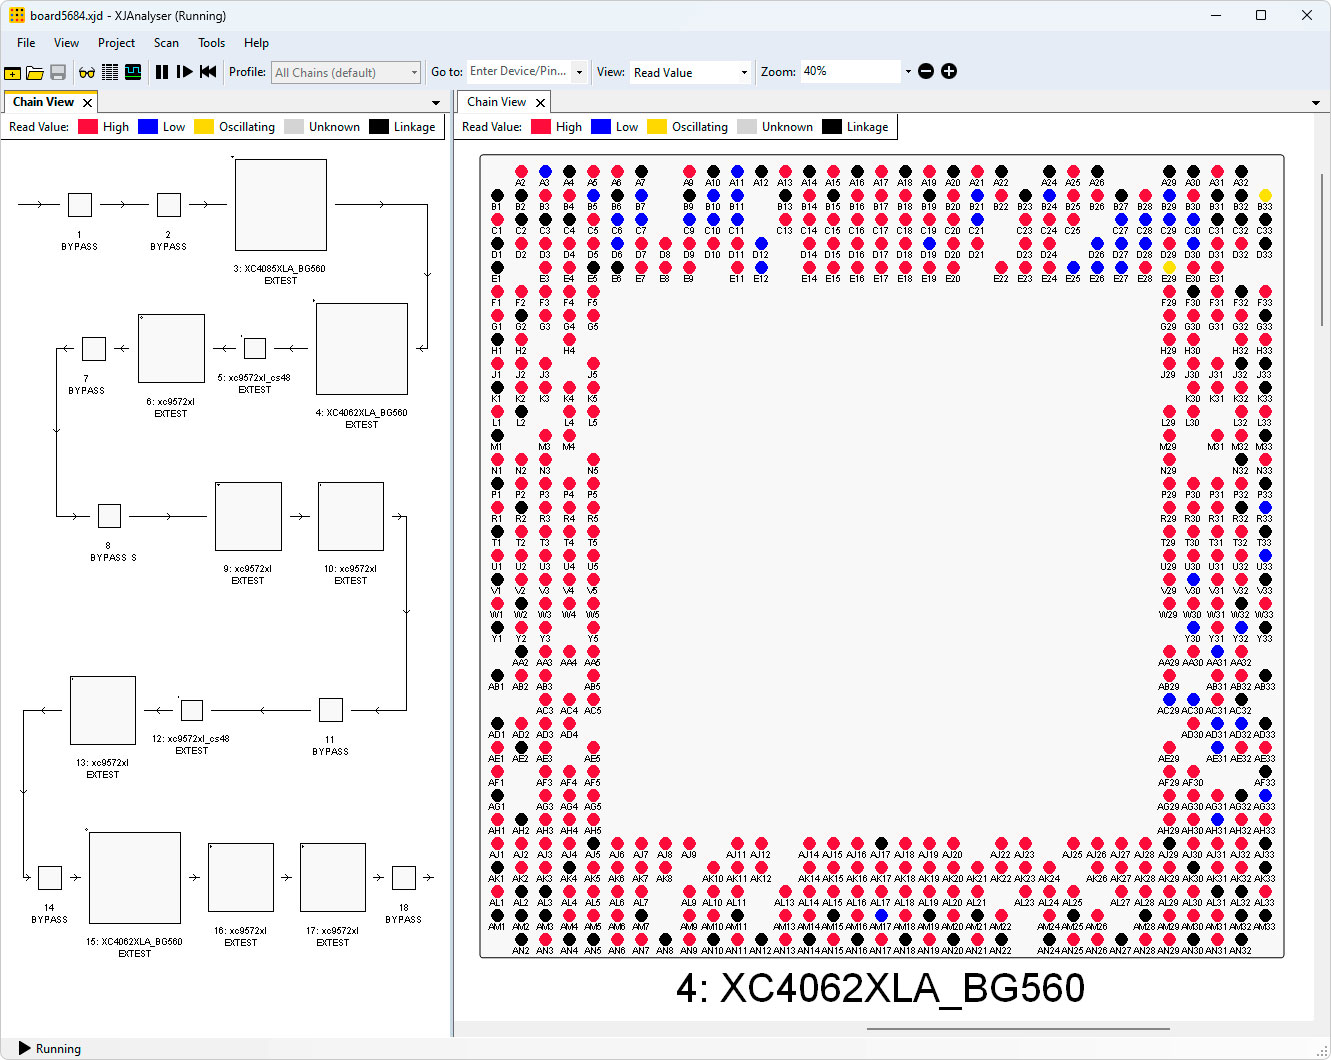
View the devices in the JTAG chains graphically, with user-definable zoom levels. You can also split the screen and view different parts of the circuit at different magnifications.
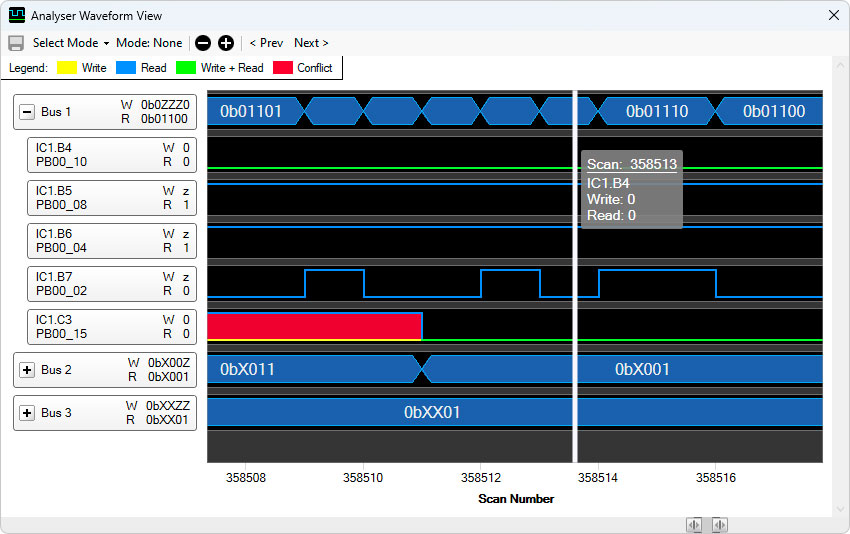
Observe pin states by looking at a table of pins and values, or graphically with the colours on a representation of the JTAG devices showing you the current state of pins. Additionally, the Waveform View captures and displays the digital signal levels and transitions of JTAG chain data, showing you the state of selected pins over a period of time.
Detect and investigate specific conditions or events by using the triggering capabilities of the waveform view, which can greatly improve an engineering team’s ability to capture key information and identify intermittent faults.
Take control of the circuit
The XJAnalyser module can either perform continuous write-read JTAG cycles, giving instant feedback on signal changes, or it can iterate single cycles under user control, allowing manual changes between each cycle.
You can run SVF and STAPL / JAM files that apply to any sequence of devices in your circuit.
The Golden Board comparison feature can capture the values being driven onto the JTAG devices of a known good board. These values can then be used to identify differences between a board exhibiting unexpected behaviour and the reference board.
Features
Graphical device view
Easily understandable way to view many pins at once
Waveform view
Waveform view shows pin values over time in logic analyser style view
Pin Watch
Monitor specific pins or look for pins changing value
Drive values to the circuit
Set a pins or groups of pins high or low with just a click
Real time display
Set or read pin values across the circuit
XJIntegration available
Use XJAnalyser module features via API from other software using XJIntegration
Trace faults
Assists in tracing signals and in locating short circuit and open circuit faults
Program JTAG devices
Program devices by running SVF and STAPL files within XJAnalyser
No-netlist operation
XJAnalyser standalone application only requires BSDL files to get up and running
Related Products
 XJAnalyser with XJLink2
Standalone real-time visual analysis/debug tool with all the capabilities of the XJAnalyser Module, provided with an XJLink2 test controller to connect to up to 4 JTAG chains in your circuit. Control JTAG device pins directly or program devices using SVF/STAPL files.
Explore or Buy XJAnalyser & XJLink2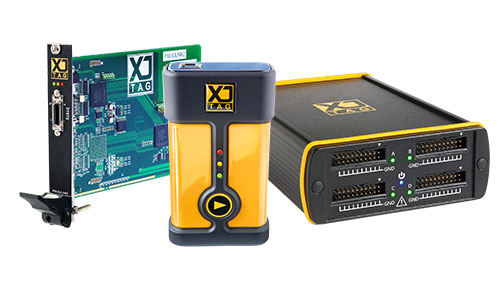 JTAG Controller Hardware
A range of high-performance JTAG boundary scan controllers are available to suit different test environments and system configurations, whether that’s a compact benchtop USB setup, integrated into a PXI rack or setup for parallel tests in production.
Explore Test Controller Range